Monthly Google clicks grew from 150 to 727.
For the shared MSM Chicken Goods and Chick'n Kitchen website, technical SEO and keyword research came first, followed by ongoing content work. Monthly Google clicks grew from 150 to 727 between May and August 2026.
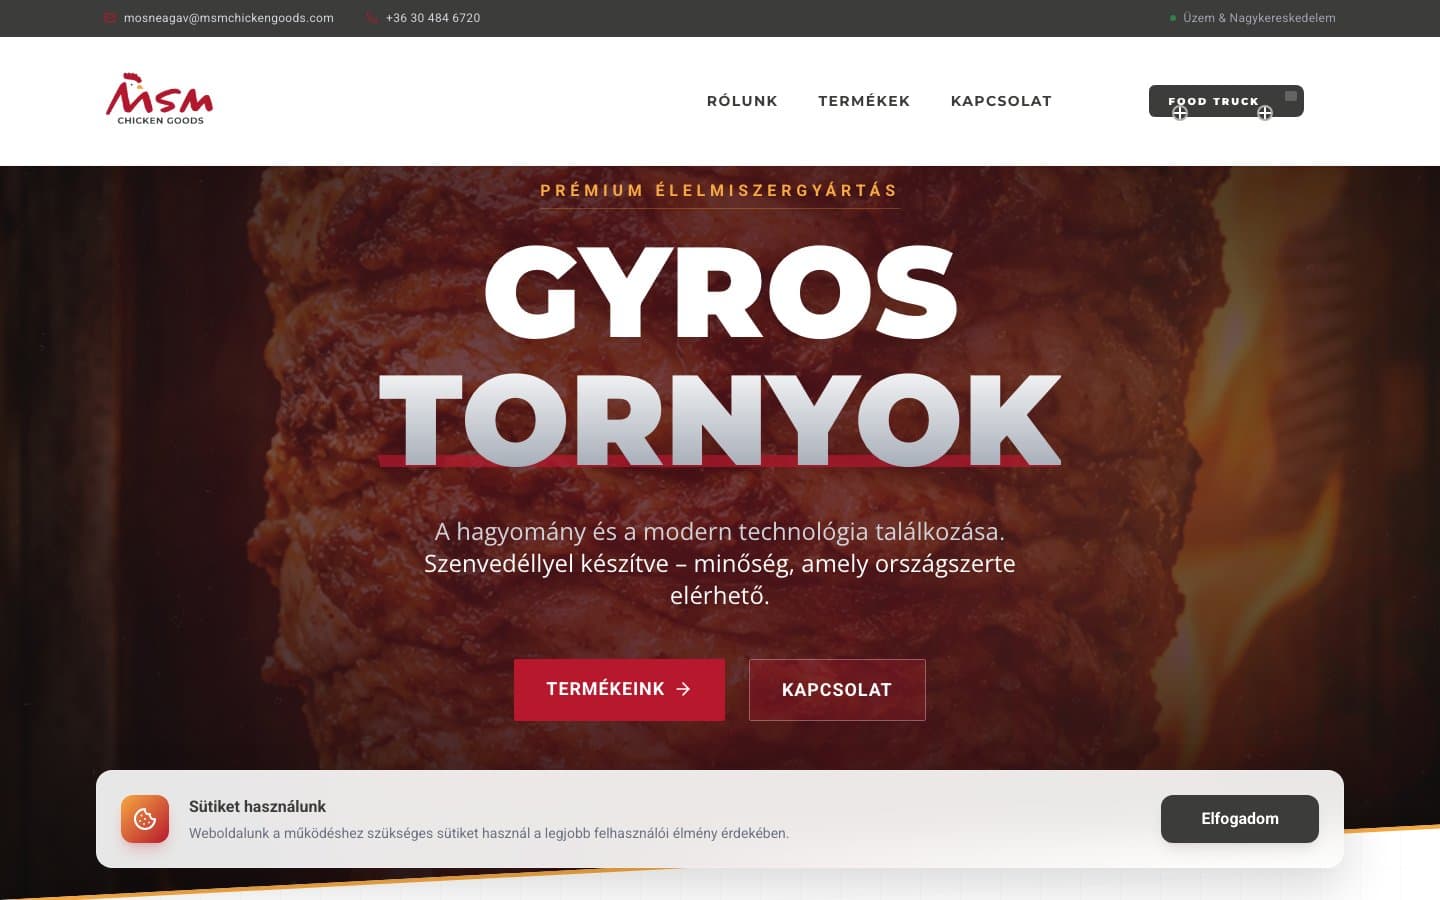
Results and measurement context
Search data comes from Google Search Console; the September comparison covers two 21-day periods. Clicks do not represent confirmed leads or orders. The Lighthouse score is the original lab result after the foundation work. GSC data checked on 24 September 2026.
Monthly clicks from Google
May–August 2026 · complete calendar months
- May150 clicks
- June395 clicks
- July615 clicks
- August727 clicks
Case study chapters
The client and challenge — one domain, two brands
The project started in April 2026 on the shared website for MV-GOODS Kft.'s brands. MSM Chicken Goods manufactures and supplies gyros meat cones to food businesses. Chick'n Kitchen operated five street-food outlets during the period examined. We assigned distinct search topics and next steps to the two audiences.
- MSM Chicken Goods — B2B: gyros meat cone manufacturing and wholesale from a Keszthely facility; restaurants, snack bars and gyros shops across Hungary; business goal: quote requests by phone, email and form.
- Chick'n Kitchen — B2C: a street-food brand offering gyros, nuggets and grilled food, with five outlets in four cities and Wolt/Foodora ordering; business goal: local customer visits from search.
At the start of the SEO project (April 2026)
- Structured data: no pages had schema.org markup yet.
- Measurement: Google Analytics and Search Console were not connected.
- Content: there was no blog or article content.
- Cookie consent: a single-button banner, without Consent Mode v2 or category-level consent.
- Performance opportunities: externally loaded fonts, unoptimised images and missing cache headers.
- Deployment: updates were uploaded manually by FTP.
Scroll sideways to view a wide table.
| Starting point | Value |
|---|---|
| Google clicks per day | ~4 — almost entirely branded searches |
| Pages indexed by Google | 4 |
| Lighthouse performance | 52/100 desktop (65 mobile) |
| Tracked contact conversion events | 0 — measurement wasn't in place yet |
The initial zero meant measurement was missing, not that there were demonstrably no enquiries. After the technical work, we tracked changes in both measurement and published content.
The solution — phase 1: foundations
The first phase established the technical foundations over one month, so subsequent content could build on an accessible, understandable site with measurable business events.
1 · Technical SEO
- Structured data (JSON-LD): Organization, WholesaleStore, 5× Restaurant for the Chick'n Kitchen locations, BlogPosting and BreadcrumbList.
- Meta descriptions, canonical, hreflang and Open Graph across all pages.
- Dynamic sitemap and RSS, with a clear robots.txt.
- Internal links between key pages and noindex on legal pages to clarify indexing signals.
2 · Performance improvements
- Self-hosted fonts, removing the external Google Fonts dependency.
- Hero rebuilt with CSS in place of JavaScript animations for faster loading and stable layout (CLS ≈ 0).
- Responsive image sizes (srcset) and modern formats.
- Compression and cache headers on the host (.htaccess).
3 · Measurement and consent
- Google Analytics 4 and Search Console setup, linked with domain-level verification.
- Conversion tracking for phone, email, form and outbound clicks, followed by article-level CTA tracking.
- Consent Mode v2 and a granular cookie banner for GDPR consent handling.
4 · Blog and strategy
- A Sanity CMS blog with categories, related articles and author blocks, rendered as fast static pages.
- Keyword research using demand data: 45 prioritised keywords (2 Tier S, 9 Tier A, 34 Tier B), with competitor analysis.
- A 12-month content strategy: five topic pillars and article clusters, planned by quarter.
Scroll sideways to view a wide table.
| Lighthouse performance | At the start | After phase 1 |
|---|---|---|
| Desktop | 52 | 100 |
| Mobile | 65 | 92 |
| Accessibility | 86–90 | 96 |
Phase 2 — monthly SEO: content based on search demand
Ongoing work began on 1 May: four articles per month, published weekly around the strategy's topic pillars. Articles addressed searches with observed demand, from local ‘best gyros’ guides to industry guidance on food safety and starting a hospitality business.
- 4 articles per month: a mix of two longer pillar topics and two more focused cluster topics.
- Internal link maintenance: connecting new articles to existing content too.
- Technical monitoring: monthly checks of indexing, Core Web Vitals and crawl errors.
- Monthly client report: positions, traffic, conversions and the next month's plan.
- Quarterly strategy review based on measured data.
Results — four complete months of continued growth
From May to August 2026, we recorded 1,887 Google clicks in total. Monthly clicks grew from 150 to 727, almost fivefold, while impressions increased from 8,419 to 38,285. August also delivered a further 18% increase in clicks compared with July.
Scroll sideways to view a wide table.
| Month (2026) | Google clicks | Google impressions | CTR | Avg. position |
|---|---|---|---|---|
| May | 150 | 8,419 | 1.8% | 4.5 |
| June | 395 | 22,882 | 1.7% | 5.5 |
| July | 615 | 33,321 | 1.8% | 5.3 |
| August | 727 | 38,285 | 1.9% | 5.6 |
All four rows cover complete calendar months from the same domain-level GSC report, using Web (text) search with no additional filters. CTR and average position did not improve every month: the sustained growth was in clicks and impressions.
Updated on 24 September 2026. Earlier reports used different reporting cut-off dates. We retrieved complete calendar months for this update, so the figures differ from the snapshots in the previous case study and historical blog references. The latest data shown here runs through 21 September.
Which searches brought visitors?
Nine of the ten leading queries in August were non-branded. Alongside local restaurant searches, people searched for calorie information and FELÍR registration guidance. This describes the ten queries with the most clicks; it does not mean that 90% of all traffic was non-branded.
Scroll sideways to view a wide table.
| Hungarian search query (August 2026) | Clicks | Impressions | Avg. position | Type |
|---|---|---|---|---|
| gyros tál kalória | 45 | 381 | 2.1 | informational |
| msm chicken goods kft | 22 | 40 | 2.3 | branded |
| legjobb gyros budapest | 13 | 395 | 6.8 | informational |
| keszthely gyros | 13 | 263 | 3.4 | local |
| gyros keszthely | 12 | 219 | 2.1 | local |
| nagykanizsa étterem | 11 | 733 | 2.5 | local |
| felir szám igénylése | 9 | 250 | 6.0 | industry-related |
| felir azonosító igénylése | 8 | 174 | 6.2 | industry-related |
| nagykanizsa gyros | 8 | 132 | 1.3 | local |
| gyros budapest | 7 | 928 | 8.0 | local |
Average position is an average across the recorded impressions, not a fixed ranking for every searcher. We classified the original Hungarian queries as branded, local, informational or industry-related.
The strongest articles — August 2026
The calorie comparison brought 137 clicks and the Budapest gyros guide 114 in a single month. For the industry audience, the guide to opening a hospitality business received 69 clicks and the FELÍR registration article 64. Both B2C and B2B topics appeared among the strongest entry pages.
Scroll sideways to view a wide table.
| Article | Clicks | Impressions | Avg. position |
|---|---|---|---|
| Gyros calories — comparing pita, dürüm, platters and salads | 137 | 6,483 | 3.8 |
| Best gyros in Budapest 2026 | 114 | 5,387 | 7.5 |
| Starting a food business in 2026 — a complete guide | 69 | 4,205 | 5.1 |
| Applying for a FELÍR registration number in 2026 | 64 | 2,329 | 6.4 |
| Best gyros in Keszthely in 2026 | 37 | 1,996 | 7.6 |
The article table uses page-level GSC data for 1–31 August. We do not turn these figures into a share of domain-level traffic, because page-level and property-level reports can aggregate results differently.
↑ Back to chaptersWhat does this mean for the business?
- Content that answers specific questions creates new entry points. The calorie comparison and the FELÍR guide reach different audiences; both are part of the content strategy built from keyword research.
- The two brands address different search needs. City-specific gyros searches serve people exploring restaurants, while hospitality guides serve an industry audience. The topic of a search alone does not establish purchase intent.
- Growth continued across several months. Clicks increased in every complete month from May to August, and the first 21 days of September also exceeded the equivalent August period.
- Search clicks and business outcomes are separate metrics. The website also tracks clicks towards contact and ordering options. This update uses GSC data and makes no new claims about confirmed leads, orders or revenue.
Source: Google Search Console, msmchickengoods.com domain property, Web (text) search. Complete months: 1 May–31 August 2026; equal-length partial periods: 1–21 August and 1–21 September. Checked on 24 September 2026. The technical baseline and Lighthouse scores come from the original project measurements. Results apply to this client and period; they do not isolate the effect of individual interventions or guarantee results for other projects.
Want to explore what's possible for your business?
Technical SEO audits, keyword research using demand data, monthly content and clear reports from one team. Let's discuss your organic search opportunities.